220314 Pandas DataFrame Fundamentals

이번 포스팅에서는 본격적으로 Pandas의 DataFrame에 대한 학습을 하면서 학습한 내용들을 정리해보려고 한다.

1
2
3
4
5
6
7
8
9
10
11
12
13
14
15
16
17
18
19
20
21
22
23
24
25
26
27
28
29
30
31
32
33
34
import pandas as pd

bank_client_df = pd.DataFrame({'Bank Client ID':[111, 222, 333, 444],
'Bank Client Name':['Laila Aly', 'Kate Steve', 'Nicole Mitch', 'Francis Morris'],
'Net Worth [$]':[35000, 3000, 100000, 2000],
'Years with Bank':[4, 7, 10, 15]})

bank_client_df

type(bank_client_df) #pandas.core.frame.DataFrame

#DataFrame의 상위 3개 값 출력
bank_client_df.head(3)

#DataFrame의 하위 1개 값 출력
bank_client_df.tail(1)

#DataFrame의 shape
bank_client_df.shape #(4, 4)

#DataFrame의 정보 출력
bank_client_df.info()

# <class 'pandas.core.frame.DataFrame'>
# RangeIndex: 4 entries, 0 to 3
# Data columns (total 4 columns):
# # Column Non-Null Count Dtype
# --- ------ -------------- -----
# 0 Bank Client ID 4 non-null int64
# 1 Bank Client Name 4 non-null object
# 2 Net Worth [$] 4 non-null int64
# 3 Years with Bank 4 non-null int64
# dtypes: int64(3), object(1)
# memory usage: 256.0+ bytes

Pandas series는 pd.Series constructor method의 parameter로 data를 넘겨주어 Pandas series를 정의하였다. Pandas DataFrame도 마찬가지로 위와같이 pd.DataFrame constructor method의 parameter로 python의 dictionary data를 넘겨주어 정의한다.
Dictionary의 key/value에서 key값이 DataFrame의 column명이 되며, value의 리스트 타입의 값이 각 row의 값이 된다.

Pandas DataFrame example
1
2
3
4
5
6
7
8
9
10
11
12
13
14
15
16
17
18
19
20
21
22
23
24
25
26
27
28
29
30
31
32
33
34
35
36
37
38
39
40
41
42
43
44
45
46
47
48
49
50
51
52
53
54
55
56
57
58
59
60
61
62
63
64
65
66
67
68
69
70
71
72
73
74
75
76
77
78
79
80
81
82
83
84
85
86
87
88
89
90
91
92
93
94
95
96
97
98
99
100
101
102
103
104
105
106
107
108
109
110
111
112
113
114
115
116
117
118
119
120
121
# Challenge#1

# 이번 챌린지에서는 Pandas DataFrame에서 보유 주식 수와 각 주식의 가격을 곱해서 합한 결과를 구하는 문제이다.

portfolio_df = pd.DataFrame({
'stocker ticker symbols': ['NVDA','MSFT','FB', 'AMZN'],
'number of shares': [3, 4, 9, 8],
'price per share[$]': [3500, 200, 300, 400]
})

portfolio_df

portfolio_df['price per share[$]']
portfolio_df['number of shares']

stocks_dollar_value = portfolio_df['price per share[$]'] * portfolio_df['number of shares']
print(stocks_dollar_value)

stocks_dollar_value.sum()

print('Total Portfolio Value = {}'.format(stocks_dollar_value.sum()))


1. DEFINE A PANDAS DATAFRAME
[2]
1
import pandas as pd
[3]
0
# Let's define a two-dimensional Pandas DataFrame
# Note that you can create a pandas dataframe from a python dictionary
bank_client_df = pd.DataFrame({'Bank Client ID':[111, 222, 333, 444],
'Bank Client Name':['Laila Aly', 'Kate Steve', 'Nicole Mitch', 'Francis Morris'],
'Net Worth [$]':[35000, 3000, 100000, 2000],
'Years with Bank':[4, 7, 10, 15]})
bank_client_df

[4]
0
# Let's obtain the data type
type(bank_client_df)
pandas.core.frame.DataFrame
[7]
0
# you can only view the first couple of rows using .head()
bank_client_df.head(3)

[8]
0
# you can only view the last couple of rows using .tail()
bank_client_df.tail(1)

[9]
0
# You can obtain the shape of the DataFrame (#rows, #columns)
bank_client_df.shape
(4, 4)
[10]
0
# Obtain DataFrame information
bank_client_df.info()
<class 'pandas.core.frame.DataFrame'>
RangeIndex: 4 entries, 0 to 3
Data columns (total 4 columns):
# Column Non-Null Count Dtype
--- ------ -------------- -----
0 Bank Client ID 4 non-null int64
1 Bank Client Name 4 non-null object
2 Net Worth [$] 4 non-null int64
3 Years with Bank 4 non-null int64
dtypes: int64(3), object(1)
memory usage: 256.0+ bytes

MINI CHALLENGE #1:

A porfolio contains a collection of securities such as stocks, bonds and ETFs. Define a dataframe named 'portfolio_df' that holds 3 different stock ticker symbols, number of shares, and price per share (feel free to choose any stocks)
Calculate the total value of the porfolio including all stocks
[20]
portfolio_df = pd.DataFrame({
'stocker ticker symbols': ['NVDA','MSFT','FB', 'AMZN'],
'number of shares': [3, 4, 9, 8],
'price per share[$]': [3500, 200, 300, 400]
})

portfolio_df

portfolio_df['price per share[$]']

# 0 3500
# 1 200
# 2 300
# 3 40
# Name: price per share[$], dtype: int64

portfolio_df['number of shares']

# 0 3
# 1 4
# 2 9
# 3 8
# Name: number of shares, dtype: int64

stocks_dollar_value = portfolio_df['price per share[$]'] * portfolio_df['number of shares']
print(stocks_dollar_value)

# 0 10500
# 1 800
# 2 2700
# 3 320
# dtype: int64

stocks_dollar_value.sum() # 14320

print('Total Portfolio Value = {}'.format(stocks_dollar_value.sum()))

# 0 10500
# 1 800
# 2 2700
# 3 3200
# dtype: int64
# Total Portfolio Value = 17200

2022/03/24(목) 추가 기록

INPUTS(CSV와 HTML DATA 읽기)

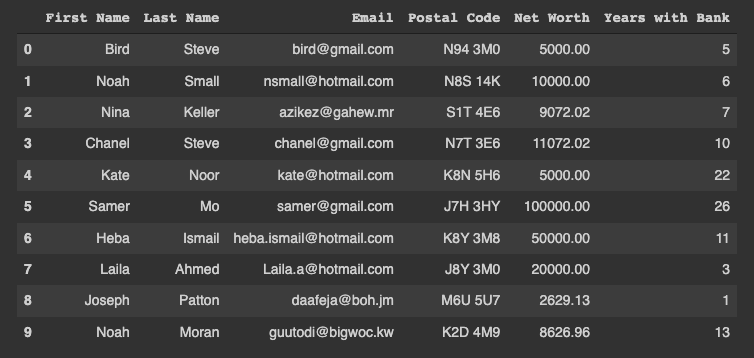
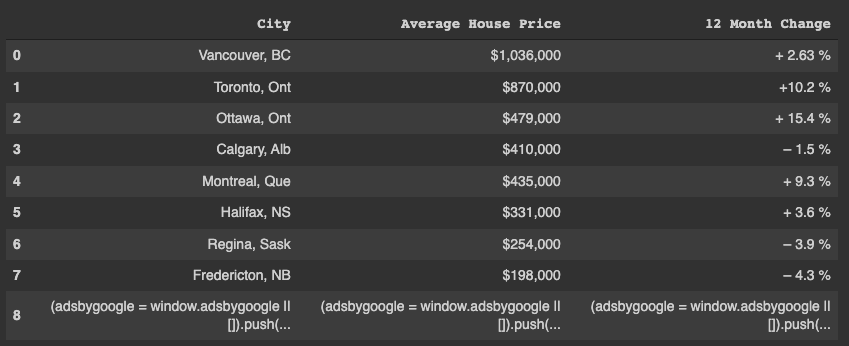
이번 파트에서는 Pandas를 활용하여 CSV, HTML 데이터를 읽고 해당 데이터를 DataFrame의 형태로 저장하는 부분에 대해서 정리해보겠다.
1
2
3
import pandas as pd

bank_df = pd.read_csv('bank_client_information.csv')
은행 고객 정보 DataFrame
1
2
3
import pandas as pd

house_prices_df = pd.read_html('https://www.livingin-canada.com/house-prices-canada.html')
은행 고객 정보 DataFrame

CSV에 데이터 프레임 쓰기

1
2
3
bank_df.to_csv('sample_output_noindex.csv', index = False)
bank_df.to_csv('sample_output_noindex.csv', index = False, compression='gzip') # 용량을 줄인다.(압축 파일 *.csv.gz)